Optimus SBR: 5 Time Winner, Awarded 2023 Best Workplaces™ in Professional Services
Optimus SBR is a 5-time winner of Best Workplaces™ in Professional Services, awarded by Great Place to Work®. This prestigious recognition highlights our bold workplace culture.
Optimus SBR Awarded 2023 Best Workplaces for Giving Back
Optimus SBR has been awarded Best Workplaces for Giving Back, and we couldn’t be more proud. To Optimus, giving back is about actively getting involved in the community and making a meaningful contribution.
Optimus SBR Named 2022 Most Admired Corporate Cultures™ Winner!
What a thrill it is to be honoured as a 2022 Most Admired Corporate Cultures™ Winner! This award celebrates the Bold Attitude and Entrepreneurial Spirit each of us embodies.
Optimus SBR is on the 2022 List of Best Workplaces™ in Ontario
We’re pleased to announce that Great Place to Work® has named us on the 2022 list of Best Workplaces in Ontario! This marks our 8th Best Workplaces award in 2022.
Optimus SBR Recognized on 2022 List of Best Workplaces™ for Mental Wellness
We are proud to announce that we have been recognized by The Great Place to Work® Institute on the list of Best Workplaces™ for Mental Wellness for the second time!
Optimus SBR is Named on the 2022 List of Best Workplaces™ in Professional Services
We are honoured to be included on the 2022 list of Best Workplaces™ in Professional Services awarded by Great Place to Work®. We have received this award for the 4th consecutive year
Optimus SBR Awarded 2022 Best Workplaces™ for Professional Development
Great Place to Work® has announced Optimus SBR as a 2022 Best Workplaces™ for Professional Development winner! This recognizes our bold culture of continuous learning.
Optimus SBR is on the 2022 List of Best Workplaces™ for Today’s Youth!
We’re excited to share that Great Place to Work® has announced Optimus SBR on the 2022 list of Best Workplaces™ for Today’s Youth. This is the second consecutive year that we’ve been named to this list!
Optimus SBR Acquires n-gen People Performance Inc.
Toronto June 9, 2022 – Optimus SBR announced their eighth acquisition in a decade with the purchase of n-gen People Performance Inc., a training organization that specializes in solutions for managing generational differences in the workplace.
Optimus SBR is Honoured to be on the 2022 List of Best Workplaces™ for Giving Back
Optimus SBR is proud to announce that we have been named on the 2022 list of Best Workplaces™ for Giving Back. This award is a reflection of Optimus SBR’s ongoing efforts to encourage and support a bold culture of giving back.
Optimus SBR Named a 2022 Best Workplaces™ in Canada
Optimus SBR has been recognized by the Great Place to Work® Institute as a 2022 Best Workplaces™ in Canada a for a 4th consecutive year! This award exemplifies the bold commitment our team makes every day to uphold Optimus SBR as a place where people come first, and culture is everything.
Optimus SBR Named to the 2022 Best Workplaces™ for Hybrid Work List
Great Place to Work® has just announced that Optimus SBR is on the 2022 list of Canada’s Best Workplaces™ for Hybrid Work! We proudly add this to our roster of awards which include Best Workplaces™ in Canada, Best Workplaces™ in Ontario, Best Workplaces™ in Professional Services, Best Workplaces™ for Giving Back, and Best Workplaces™ for Today’s Youth!
Optimus SBR Named Best Workplaces™ for Giving Back 2021
Optimus SBR is honoured to be recognized on the 2021 list of Best Workplaces™ for Giving Back in Canada. We feel fortunate to be a part of an organization that has built a culture around putting people first, both within our organization and the greater community. Congratulations go to our Corporate and Social Responsibility Committee, Volunteers, and Donors!
Optimus SBR Acquires Unilytics and Launches Optimus SBR Data
Toronto, June 22, 2021, – Today Optimus SBR, one of the largest independent management consulting firms in North America, announced their seventh acquisition in a decade with the purchase of a data advisory and analytics firm – Unilytics. At the same time, they announced the formal establishment of Optimus SBR Technology.
Optimus SBR Named as 2021 Great Place to Work
Optimus SBR has been named as Great Place to Work for a third consecutive year.
Optimus SBR named to the Growth List for 8th Consecutive Year!
Canadian Business named Optimus SBR on the 32nd annual Growth List!
Optimus SBR Named as 2020 Great Place to Work
For the second consecutive year, Optimus SBR is thrilled and honoured to be named on the 2020 list of Best Workplaces in Professional Services, and as one of this year’s Best Workplaces™ in Canada. This year, we’ve also been named to the inaugural list of Best Workplaces in Ontario.
Optimus SBR Ranks on The Globe and Mail’s Brand-New Ranking of Canada’s Top Growing Companies
Report on Business and The Globe and Mail released the inaugural list of Canada’s Top Growing Companies and ranked Optimus SBR No. 168.
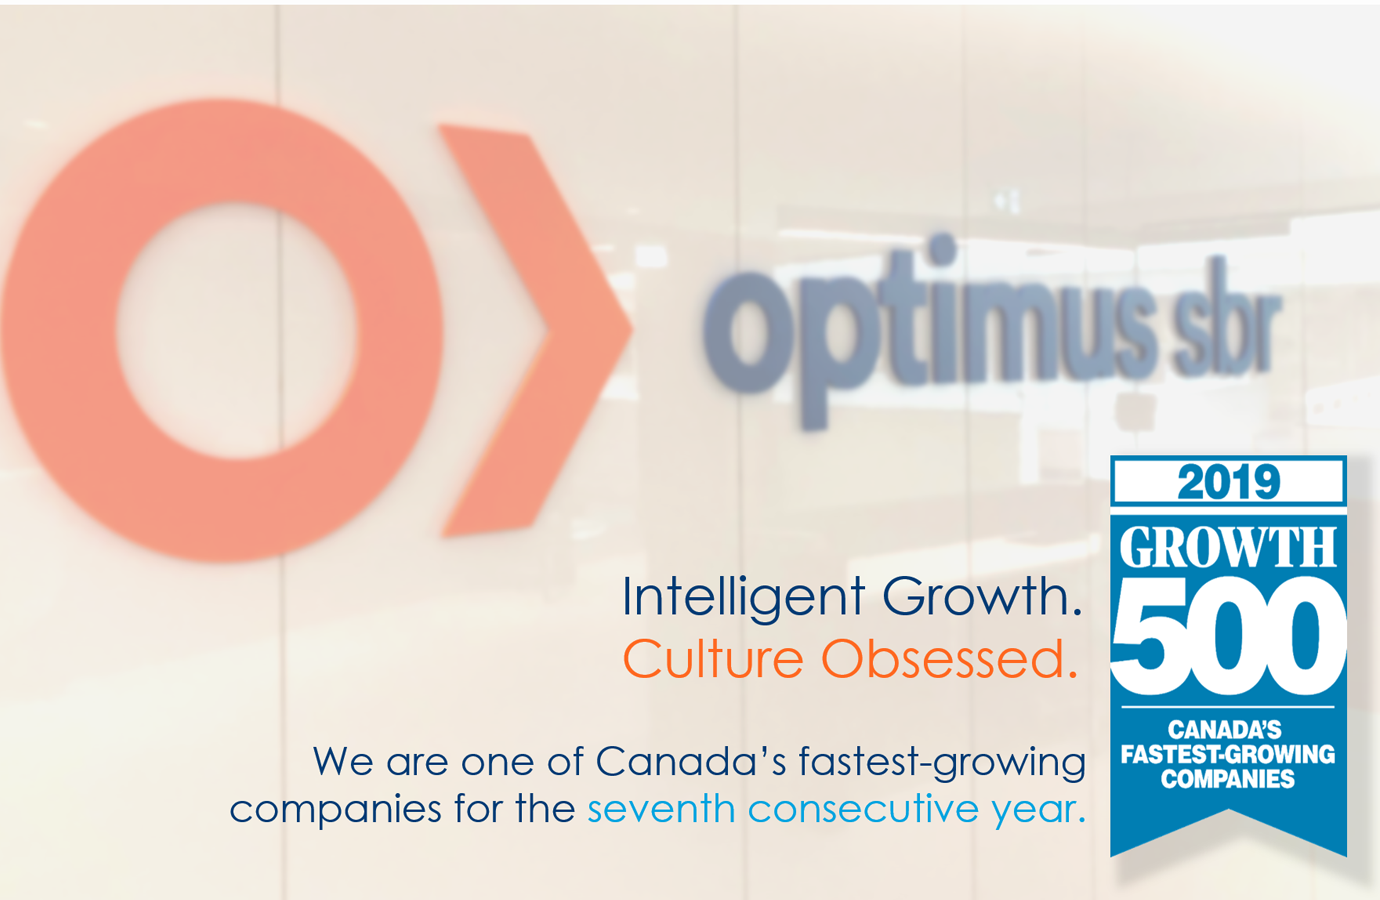
Optimus SBR Ranks on the Growth 500 for the Seventh Consecutive Year
Canadian Business and Maclean’s magazine released the list of Canada’s Fastest-Growing Companies and ranked Optimus SBR No. 273 on the Growth 500. This is the seventh year that Optimus SBR has ranked on the Growth 500.
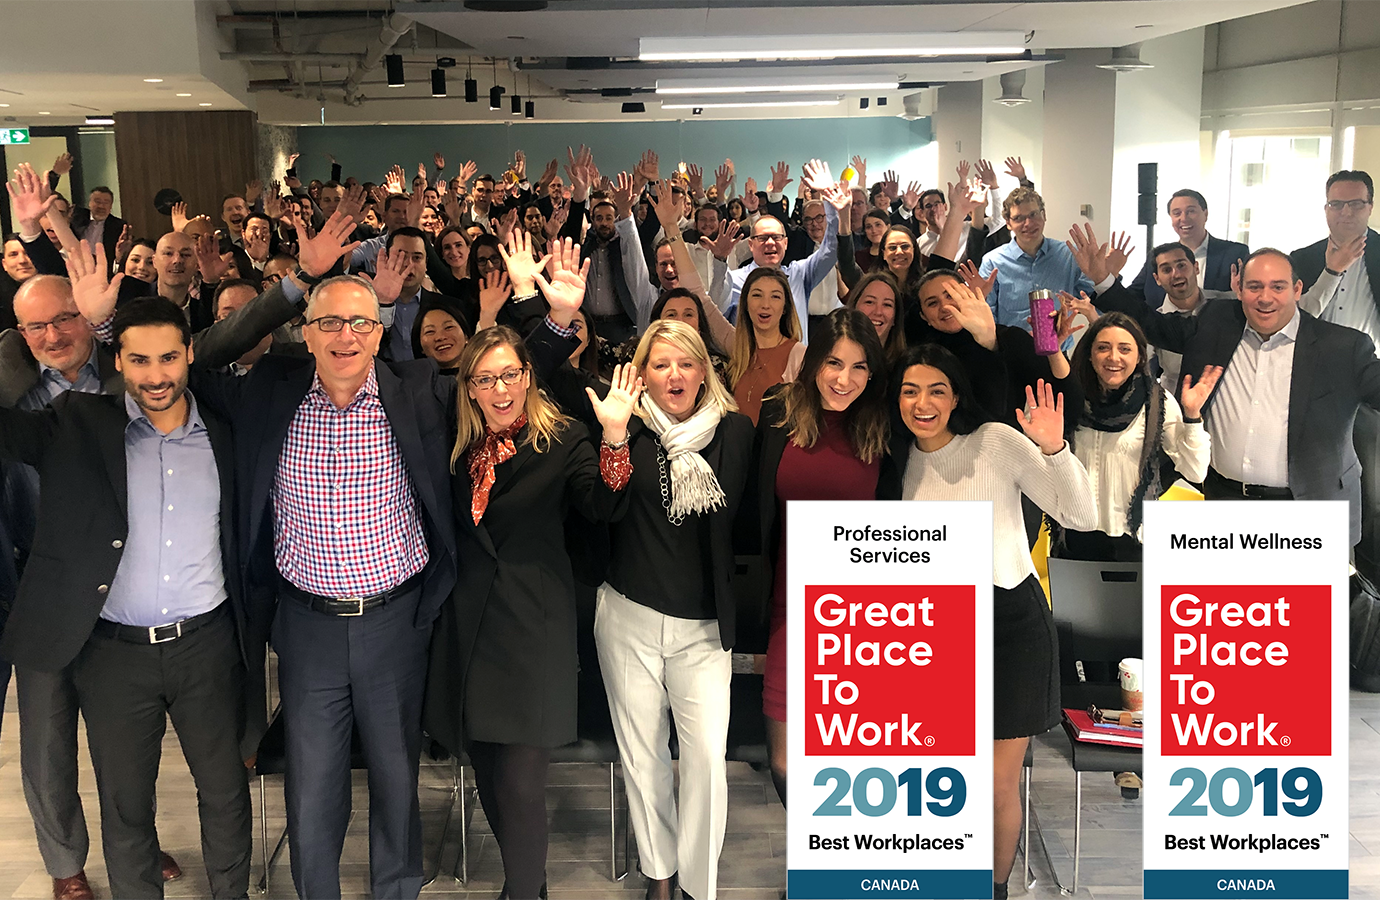
Optimus SBR Named on 2019 Lists of Best Workplaces™ for Professional Services and Mental Wellness
At Optimus SBR, our success is directly correlated to the happiness and engagement of our people and we are proud to announce that our organization has been named on two additional 2019 lists of Best Workplaces™ – Professional Services and Mental Wellness.
Optimus SBR Named as 2019 Great Place to Work
We ranked 27 out of 50 in Canada for businesses between 100-999 employees.
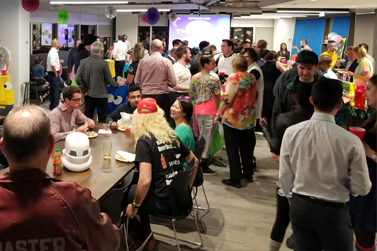
Play It Forward 2018
The 1980’s were back in full force at Optimus SBR on Thursday, November 15th as our team came together for the sixth annual Play it Forward event in support of two local charities.
Optimus SBR Acquires BottomLine Group
As part of its continuing growth strategy, Optimus SBR has acquired fellow industry leader BottomLine Group.
We Keep On Growing
Bold attitude and an entrepreneurial spirit. That’s what we keep coming back to as the reasons for our continued growth over the past eight years, and as evidenced by our inclusion in the Growth 500 for 2018.
Optimus SBR Named as Best Small and Medium Employer for a Fifth Year
For the fifth consecutive year, we are honoured to announce that OPTIMUS | SBR has been named one of the Best Small and Medium Employers in Canada, Platinum.
SEG Management Consultants Acquired by Optimus SBR
The purchase of SEG is yet another strategic investment for us as it supports our goal of strengthening and expanding our position as a trusted advisor in the public sector.
PMC Consulting Acquired by Optimus SBR
Over the past several years, we have continued to grow our organization through the deepening of industry knowledge and the expansion of our capabilities. We consistently aim to strengthen our value proposition and our relationship with you.
Optimus SBR Acquisition Results in Expanded Healthcare Practice
The purchase is a key investment as OPTIMUS | SBR looks to strengthen its position as a leader in the healthcare and not-for-profit sectors. RWS Advisory specializes in strategic and operational consulting to public, non-profit and private healthcare and life sciences organizations.
Optimus and Kemerer Group Merge
Optimus Consulting Group and Kemerer Group Inc. announced today the closing of the agreement to merge their operations and jointly purchase the assets of SBR Global. T